
Volume 50 🎉
The Security Breakdown is really about this community.
The people paying attention to the signals shaping the future of security.
Thanks for being part of the first 50. Here’s to the next 50.
This Week’s Featured Articles, Media, & Breaking News
✍🏻 Articles
Tony Dong | The Folly of Relying on Book Value for Modern Stock Pickers
Book value still drives many stock screens, but it can make you miss McDonald’s and chase Kraft Heinz.
Read below
James Gammon | Are Your Door Openings Secure?
If you can’t confirm the door is closed and latched, you don’t have control.
Read below
Ria Van Hoef | Your GSOC Isn’t Failing Because of What it Catches
Your GSOC isn’t drowning in alerts, it’s missing the breach.
Read below
Jon Polly | The Chipset Story – Why This Is Different Than Before
AI datacenters are choking chip supply, driving price spikes and long lead times.
Read below
🎙 Secured Podcast
Episode 6 | Is NextNav About to Wipe Out 500 Million Security Devices?
Acquisitions, platform momentum, and a policy fight most of the industry hasn’t noticed yet, but probably should.
Listen now.
🚨 Breaking News
Breaking: HID launches the HID Access Fellowship
Breaking: dormakaba acquires any2any GmbH, adding a digital experience platform
Breaking: ASSA ABLOY Group Acquires Sennco Solutions, Inc.
Breaking: Allegion Acquires DCI Hollow Metal on Demand
Scroll down to go deeper ↓

Every famous investor has one or two metrics they’re closely associated with. For Peter Lynch, it was the PEG ratio, short for price-to-earnings growth. The idea is straightforward. You take a company’s price-to-earnings ratio and divide it by its expected earnings growth rate
On the other end of the spectrum, economist Robert Shiller, author of Irrational Exuberance, developed the cyclically adjusted price-to earnings ratio, commonly known as CAPE. Instead of looking at a single year’s earnings, CAPE averages inflation-adjusted earnings over ten years. The goal is to smooth out business cycles and prevent investors from overreacting to temporary booms or busts.
Then there’s the Buffett Indicator. It’s simply total market capitalization divided by GDP. The idea is to compare the value of the stock market to the size of the underlying economy. At roughly 230% today, it suggests that U.S. equities are priced at more than double annual economic output.
One that has not aged well as a primary screen is book value. Book value is calculated as total assets minus total liabilities. On a per-share basis, it represents the accounting value of shareholders’ equity. In isolation, it measures what the company would theoretically be worth if you liquidated its assets and paid off its debts.
That worked reasonably well in a market dominated by railroads, manufacturers, and asset-heavy industrial firms. Factories, machinery, and inventory were tangible and measurable. Book value approximated economic value closely enough to be useful.
That’s no longer the world we live in. Today’s market is dominated by companies whose most valuable assets don’t sit cleanly on the balance sheet. Brand equity, intellectual property, software, network effects, and customer relationships are often expensed rather than capitalized.
Meanwhile, acquisitions can inflate goodwill, and aggressive share repurchases can distort equity values. The result is that book value often tells you more about accounting conventions than economic reality. If you rely on book value as your primary screen in 2026, you will almost certainly be led astray.
To make that concrete, we’ll look at two blue-chip consumer companies. If you screened purely on book value, you might have avoided what turned out to be a solid long-term investment in McDonald's, or worse, doubled down on what became a value trap in Kraft Heinz.
McDonald’s: Negative Book Value, Positive Shareholder Yield
Let’s start with what McDonald's actually is. Most people think of it as a burger chain. Financially, it behaves much closer to a global real estate and franchising platform.
McDonald’s generates the bulk of its operating income not from selling burgers directly, but from franchising. Franchisees pay upfront fees and ongoing royalties, often structured as a percentage of sales. In many cases, McDonald’s also owns the underlying land and building, leasing it back to operators. That combination of royalties and rent is extraordinarily powerful. It produces stable, high-margin cash flow that scales globally.
Segment-wise, the business is split between U.S. operations and international markets, with further distinctions between wholly owned stores and franchised locations. The U.S. is mature and saturated. International markets provide growth, but even there, this is not a hyper-growth story anymore. It’s a mature, optimized system.
So, when you hit saturation, what can you do? You can open incremental locations in underpenetrated areas. You can raise menu prices. You can improve unit economics by reducing backend costs, optimizing supply chains, or pushing digital ordering and drive-thru throughput. All of this drives earnings per share higher, which, over long periods, tends to support stock price appreciation.
Or you can engage in financial engineering. McDonald’s is one of just over 60 Dividend Aristocrats in the United States, meaning it has raised its dividend for at least 25 consecutive years.
Now here’s the part that confuses people. On the balance sheet, McDonald’s book value per share has been negative. It approached -$12 per share around the COVID period and remains negative today, around -$2.5. On the surface, that looks alarming.
Book value, as we discussed earlier, is total assets minus total liabilities. A negative figure suggests liabilities exceed assets. For a blue-chip company, that feels wrong. Yet during the same period where book value per share deteriorated, the stock price marched steadily higher. Dividends increased.
The following chart on a percentage basis, makes it even clearer. Book value per share fell sharply over the past decade. Meanwhile, dividends per share climbed over 100%. The share price followed cash returns, not accounting equity.
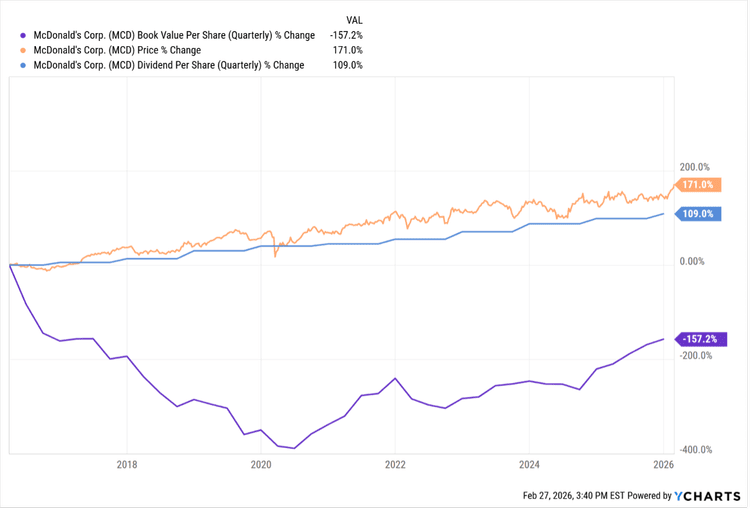
Book value shrank largely due to capital structure decisions, not operational collapse. McDonald’s has funded dividend growth with debt. As of the most recent quarter, it carries roughly $54.8 billion in total debt against about $774 million in cash.
That sounds extreme in isolation, but context matters. The company’s trailing twelve-month levered free cash flow is about $6.3 billion. This is a business that knows, with reasonable confidence, how much cash it will generate each quarter outside of severe shocks like a global pandemic.
Management’s logic is straightforward. If we can borrow at relatively low rates, and we have durable, recurring cash flows to service that debt, we can return capital aggressively to shareholders. Raise the dividend. Increase earnings per share mechanically, even if net income grows modestly.
It is leverage deployed deliberately. If you had screened McDonald’s solely on book value and rejected it because equity was negative, you would have missed a decade of steady share price appreciation and a rapidly compounding dividend stream.
Book value told one story. Free cash flow and capital allocation told another. In this case, the latter was the one that mattered.
Kraft Heinz: Trading Under Book Value as a Trap
So, we’ve established that a negative book value isn’t automatically a red flag. In McDonald’s case, it was largely the byproduct of deliberate leverage and aggressive shareholder returns. But what about the opposite scenario, when a company trades below its book value?
In the era of Benjamin Graham, before instant screeners and algorithmic trading, you could theoretically flip through financial statements, calculate assets minus liabilities, divide by shares outstanding, and conclude that if you bought the stock at a discount to book value, you had a margin of safety. If liquidation value exceeded market price, you could win even if the business muddled along.
Today, it can be a trap. Take Kraft Heinz. The stock currently trades at roughly 0.7 times book value. On paper, that suggests you’re buying assets for seventy cents on the dollar. A naive investor might reason that if you bought the entire company, liquidated the assets, and paid off liabilities, there’s thirty cents of upside embedded in the accounting.
Not quite. To understand why, you have to revisit how Kraft Heinz was created. The company was formed in 2015 through the merger of Kraft Foods and Heinz, orchestrated by 3G Capital with backing from Berkshire Hathaway. The playbook was straightforward: combine two iconic brands, slash costs aggressively, improve margins, and generate enormous cash flows.
For a while, it looked plausible. But the consumer landscape shifted. Private labels gained traction. Health-conscious trends undercut processed food demand. Brand power eroded. Meanwhile, the cost-cutting machine had already squeezed much of the easy margin expansion out of the system.
What remained was a slower-growth, heavily leveraged packaged food business with aging brands. Berkshire held on. Buffett has openly acknowledged that it was a mistake in terms of purchase price and assumptions about brand durability.
Now look at the following chart. Over the past decade, Kraft Heinz has consistently traded below its book value. At numerous points, an investor screening purely for price-to-book could have concluded this was a bargain. Yet the share price is down roughly 68% over the period shown.
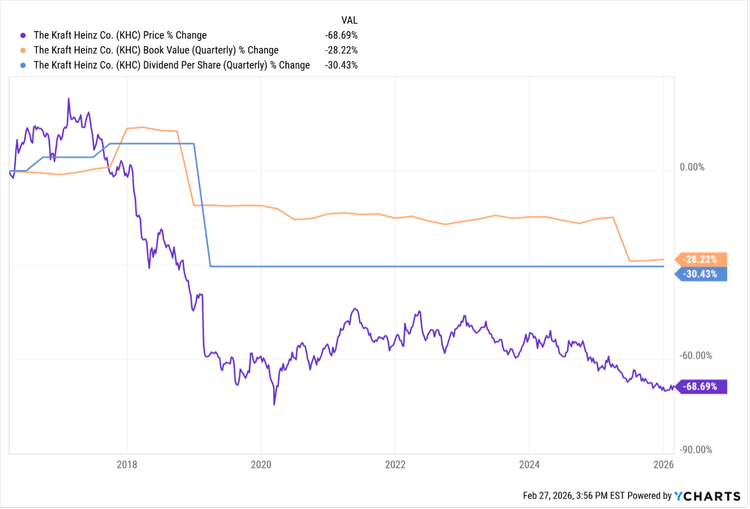
Unlike McDonald’s, Kraft Heinz did not steadily grow its dividend. It actually cut it! There was no disciplined, visible capital return engine offsetting operational stagnation.
In theory, management could have leaned into leverage the way McDonald’s did. Both are large-cap S&P 500 companies. Both have access to credit markets. Kraft Heinz could have borrowed at competitive rates and engineered buybacks to mechanically boost per-share metrics. But that would have required confidence in the durability of cash flows, and that confidence simply wasn’t there.
That’s the key distinction. Book value tells you what’s left after subtracting liabilities from assets. It says nothing about how efficiently those assets generate cash. It says nothing about competitive positioning. It says nothing about management’s willingness or ability to allocate capital intelligently. You can buy seventy cents on the dollar and still lose money if the dollar is shrinking.
The lesson isn’t that book value is useless. It’s that it’s incomplete. Without free cash flow growth and disciplined capital allocation, a discount to book can persist indefinitely. In modern markets, cheap on paper does not mean cheap in reality.
The Door Security and Safety Foundation (DSSF), in collaboration with the Door and Hardware Institute (DHI) has formed a task force of experts to recommend levels of security required for building openings, as there are no national standards. The following three levels are intended for public use to help educate and provide advice on specifying and furnishing the necessary attributes of a secure opening on any project. These levels are meant to Deter, Detect, and Delay adversarial behavior to allow time for emergency response personnel.
When associating security levels, consider the probability of risk. When assessing the risk of adversarial behavior at an exterior or interior perimeter opening, it is helpful to be able to quantify the risk by considering both the probability of this event occurring and the potential consequences. This assessment will guide users to the most appropriate mitigation recommendations listed below.
3 Levels of Secure Openings:
The security levels provided above are outlined as general in nature to account for all structures or building types as a basis of design for your reference.
Level 1 – Basic level of control and security.
Openings are flush and may or may not have a visible glass area within the door. They are securely latched, locked, and have some form of controlled or monitored access, either mechanical or electronic. When monitoring is used, monitoring should cover the door position within the opening and the latch position.
Level 2 – Intermediate level of control and security.
Openings are flush or have a visible glass area within the door. They are securely latched, locked, and have some form of electronic access control and monitored access. At a minimum, monitoring will cover door position within the opening and latch position.
Level 3 – High level of control and security.
Openings are flush or have a visible glass area within the door. They are securely latched, locked, and swing out. The doors are made of UL-rated [1] construction for bullet resistance with appropriate core material and glazing, if applicable [1]. They have some form of electronic access control and monitored access. At a minimum, monitoring must cover the door position and latch position.
For more details about these security levels as they pertain to perimeter and interior openings by different opening types and usage, download the full “Are Your Door Openings Secure” document.
Additional security level recommendations for openings located on the PERIMETER of a structure:
DSSF/DHI have outlined the following opening types to help determine the usage purpose and corresponding security levels. The following recommendations can be used in conjunction with some form of controlled access or camera systems already in place.
Primary Entrance Openings – The main ingress and egress [2] points of a structure are the areas around its perimeter where visitors enter and exit the building. It is recommended that access through these points be controlled and monitored.
Secondary Openings – Perimeter openings are defined as additional entrance options around the perimeter of a structure that serve as ingress and egress [2] points for traffic into and out of a building for special circumstances or events. During normal operations, these openings serve as emergency egress locations and should never be automatically unlocked on a timed schedule. Optional monitoring of door and latch positions may be included.
Tertiary Openings – The purpose of these openings is to provide egress [2] out of a structure only. They are not intended to be used as an access point into the building. Additionally, the hardware will not include a means of opening the door from the outside, unless required by code officials or the local Authority Having Jurisdiction (AHJ). It is recommended that these doors and areas beside the door openings do not contain glass or glazing.

An employee finishes their shift and walks out the back door of a secured facility. The door alarm fires. An operator sees the alert, checks the feed, confirms it’s an authorized exit, and clears it. Routine. Happens multiple times a day.
But the door hasn’t fully closed yet. A few seconds later, someone catches it before it latches and walks in. No badge. No alarm. No log entry. The system already moved on. As far as your GSOC is concerned, that entry never happened.
This isn’t a hypothetical. I’ve watched it happen on camera. And it exposes a problem the security industry barely talks about.
Ask any security leader what’s broken about their GSOC, and you’ll hear the same answer: too many false alarms. It’s the stat everyone knows—somewhere between 94 and 98 percent of security alarms are false. Operators are drowning in noise, turnover is brutal, and the industry has spent years trying to solve it.
That’s a real problem. But the industry’s fixation on false positives is blinding us to something far more dangerous: the false negative. The event that actually matters—the unauthorized entry, the security breach, the thing you built the GSOC to catch—that slips through because your system was never designed to see it.
That back door scenario? The alarm did exactly what it was configured to do. It fired when the door opened, it was assessed, and it cleared. The system worked perfectly. And someone still managed to walk into a secured facility completely undetected.
Traditional monitoring treats every alarm as a discrete, isolated event. It opens, it’s assessed, it closes. But real threats don’t follow that cadence. They exploit the gaps between events—the seconds after one alarm clears and before the system resets its attention.
A door alarm that fires and clears is a closed ticket. What happens in the moments after that ticket closes doesn’t exist. There’s no second trigger. There’s nothing for the operator to see. The intruder didn’t defeat the system. They just walked through the gap the system created by design.
And this isn’t limited to back doors. The same logic applies across access points. Tailgating through a lobby turnstile after an employee badges in. Catching a loading dock door before it rolls shut. Following a delivery driver through a service entrance. These are all events that happen between alarms, in the dead space where no system is watching.
There’s a compounding problem here, too. Alarm fatigue doesn’t just slow operators down—it conditions them. When 96 out of every 100 alerts are noise, operators develop a rational, human response: they pattern-match for dismissal. They’re not negligent. They’re adapting to a system that has trained them to deprioritize.
So even when a real event does generate an alert, the odds of it getting the attention it deserves are diminished. The false negative is hidden within the false positive problem. That’s what makes it so dangerous—the two failure modes reinforce each other.
• • •
Most organizations measure GSOC performance by response time: how fast did the operator acknowledge and act on the alarm? That metric makes a dangerous assumption—that the alarm fired in the first place. It assumes the system saw the event.
I think the industry needs a different question. Instead of “how fast do we respond?” we should be asking “what are we not seeing?”
That’s a harder question. It requires looking at alarm data not as a queue to be cleared but as an intelligence source. It means doing root cause analysis on recurring alarms—not just resolving them, but understanding why they keep happening and what they might be masking. A door-held-open alarm that fires every Tuesday at the same entrance isn’t random. It’s a process failure someone has decided to live with. And every time it fires and clears, it’s creating another window for an undetected entry.
The best-performing GSOC isn’t the one with the fastest response time. It’s the one that has the fewest alarms to respond to—because they’ve done the work to eliminate root causes. And it’s the one that has closed the gaps where real threats walk through undetected.
That employee who walked out the back door didn’t do anything wrong. The operator who cleared the alarm did nothing wrong. The system did exactly what it was built to do. And someone still got in.
We’ve spent years optimizing for the alarms we can see. Maybe it’s time to start worrying about the ones we can’t.
Scarce products, Price increases, long lead times, Brand distrust, and more. Sounds all too familiar? This was the outcome throughout most of COVID-19. As an industry, many companies changed their supply chain to prevent this from happening again. But history is repeating itself in a new way.
The Origin
The hyperscale datacenter movement is upon us. Every company that can find land and power is jumping into the hyperscale datacenter world, hosting all of these artificial intelligence (AI) models that are so widely being talked about and taught. Power companies are not looking at where they are going to route power for the next Tesla car park, but rather, they are building up infrastructure exponentially around where hyperscale data centers are being built. Hyperscalers are being told that if they want the power, the onus is on them. Design and build the substation to the power company’s specification, sign the substation over, and the power company will bill them. And they are doing it with a smile on their faces. Upon completion, they are ordering multi-billion-dollar worth of servers, filled to the brim with compute, storage (spinning disc, SSD, and SD), and GPU. The reality is the hyperscale datacenter industry is just getting started, and there is no sign that it will slow down anytime soon. With the money being spent, there is no reason slow down either.
The Impact
The impact of this on the security industry is already being felt. Roadmaps are already being challenged, changed, or obliterated. Partnerships are being delayed. Manufacturers are having to increase pricing by 50% on servers and cameras. Quotes are valid for 7-14 days only. Wait times are already in months, not weeks, and the delays seem to just be starting. Are we heading to COVID-era delays? Time will tell. This is not meant to be woe and fear-mongering, but a reality check. Unlike COVID, where the chips were sitting on ships ready to enter port, this is different. The factories are running at 100% plus to keep up with demand, and they are already falling behind. COVID was a six-month disruption that impacted the security industry for two years. This is different. The impacts of this may be felt for much longer, as it is not a blockade of supply, but simply no supply. Is the answer more foundries, like the two Intel foundries in Ohio that made the news in 2022, now delayed until at least 2030? The fact is that it will take at least five years once construction starts for the first chips to roll off the line.
This impacts the security industry across every part of the supply chain. Manufacturers are already struggling with supply. Do they allow customers to pre-purchase at a set rate, like prepaying gas for a rental car? Do they move to an as-a-service model for hardware, so they can ride the delta? Do they hold back stock for their largest customers? The reality is that once pricing goes up, it rarely comes back down. Tariffs have already forced many to increase prices; now a shortage. There is a very unfortunate possibility that some manufacturers, even some large ones, in our industry may not make it through this time.
Security consultants are finding that projects that were planned are already slowing down. Budgets can only be stretched so far. Security consultants live in the world of 18-month roadmaps, and with the next 18-months in disarray at the very least, this will make it very difficult to design and specify technologies that may not be available.
Integrators are already feeling the effects. Pricing guarantees are limited. Equipment guarantees are for what is on the shelf currently; future orders are questionable. Many are worried that manufacturers will repeat similar strategies from COVID, where large end-users were influencing the manufacturers, so the manufacturers cancelled or bought back stock from the integrator. This is where line cards get destroyed; relationships of years grow silent. Integrators get in a bind, and when they cannot buy from reputable retail sources, they turn to grey market solutions to meet the demand.
The end-user suffers from all of the above. When the average customer project moves from proposal to PO in under 90 days, they and the rest of the supply chain are trying to navigate just shy of seven price increases during that timeframe.
The Challenge
This may sound like a “doom-and-gloom” article, but it is also a challenge to everyone in the security industry. How do we get ahead of this NOW? Is it a financing model for those who can spread out the costs over the next “x” years? Do projects slated for 18-months get implemented faster? This is not a game of winning. It is a fight for survival.
|
Podcast | Secured: Episode 6 |
Breaking News | PSA Network and The Access Control Collective release State of Security Integrators 2026 Report
The State of Security Integrators 2026 report, built from PSA’s Financial Metrics Survey and insights from 116 integrators, offers a rare, data-driven look at where the industry is growing, and where it still needs to evolve. Access the report here.

The PhySec Collective Breakfast is a community-first gathering bringing 300+ physical security operators, builders, and leaders together before ISC West, with proceeds benefiting FAST. Sponsored by Grid Squared Systems, YourSix, Sharlic, PDQ, PassiveBolt, Acre Security, Brivo, Connectivity Standards Alliance, HID, and SwiftConnect. Register here.

ACS26, The Access Control Summit, is heading to New Zealand in 2026, hosted in collaboration with our city-host, Gallagher Security. Join us October 7–8, and sign up here to be notified first when registration goes live.
